
Chanalyzer with Report Builder
USD $750
The best Layer 1 and Layer 2 Wi-Fi Channel Analyzer
Created by the team behind inSSIDer and Wi-Spy, Chanalyzer 6 is a super-smart tool used by technicians and Wi-Fi consultants for on-site troubleshooting and spectrum analysis.
With a clean user interface, information drill-downs, and detailed data-gathering, Chanalyzer is an exceptional way to find and fix problematic client behavior and improve the Wi-Fi experience of users on your network.
 Perpetual License
Powerful Tri-Band Spectrum Analysis
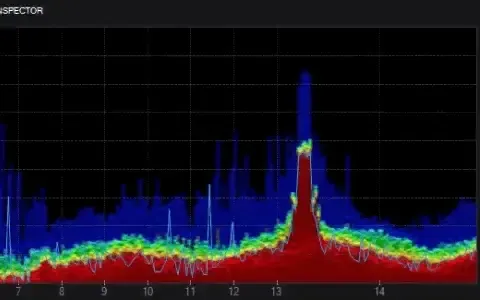
Chanalyzer unlocks the full capability of Wi-Spy Lucid, a powerful tri-band spectrum analyzer that measures WiFi and non-WiFi activity in the 2.4 GHz, 5 GHz and 6GHz bands. Chanalyzer utilizes radio frequency data from Wi-Spy to provide you with a real-time visual overview of your WiFi network environment.
Locate Sources of Interference
Once you're able to see interference, the next step is to eliminate it. Unlike the omnidirectional WiFi antenna in your laptop or wireless adapter, our Interference Finder Directional Antenna is highly focused to pinpoint non-WiFi sources of interference. This allows you to actively seek out and remove loud transmitters from your WiFi environment.
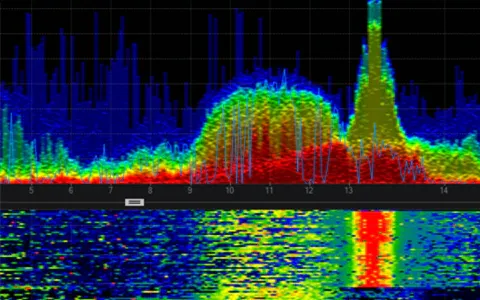
Monitor Channel Saturation and Intermittent Interferers
By graphing every access point within reach and pairing it with the raw RF information provided by Wi-Spy, Chanalyzer provides you with all the information you need to monitor and manage saturated channels. The built-in recording feature even allows you to track the most frustrating WiFi problem – intermittent interference – and come up with a plan to eliminate it for good.
Find and Eliminate WiFi Dead Spots
Nobody likes a Wi-Fi dead zone. Whether you’re planning a new network or keeping an existing one running smoothly, Chanalyzer’s tools let you map SSID signal strength and spot gaps in coverage. The result? Seamless connectivity and happier users.
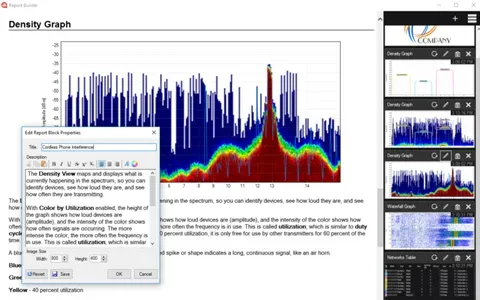
Report Your Findings with Ease
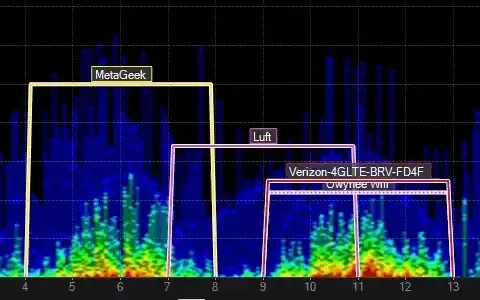
Identifying gaps in your coverage area is paramount, whether you are planning out a network the first time or testing existing coverage to maintain reliability. Chanalyzer quickly reads the wireless environment, displays every SSID within range, and reports the signal strength in real time so you can ensure quality coverage for your users.
Utilizing the Report Builder, you can add a snapshot of any image or table with just a few clicks. Then add your own pictures and descriptions (or just use the defaults) to provide context. After you’re done, export to PDF to create a visually compelling report of dead spots, saturation, and rogue APs that your boss or clients can understand. View Sample Report
Software Specifications
- Windows 8 (and newer)
- Mac OSX 10.14 Mojave and newer (Chanalyzer Lite only)
- Chanalyzer Application Frequency Ranges:
2.400-2.500 GHz
5.145-5.860 GHz
5.925-7.125 GHz
- Chanalyzer Application Frequency Resolution
2.4 GHz: 390 KHz
5.8 GHz: 1.396 MHz
6E: 1.786 MHz
Requires Wi-Spy spectrum analysis hardware: www.metageek.com/wi-spy/
Includes 1 year of MetaCare: What is MetaCare?
Subscribe for Updates
Enter your email to subscribe to our newsletter and receive updates.
About OSCIUM
At Oscium, we've spent over 15 years turning complex technology into tools that
work better for everyone.
©2025 OSCIUM. All Rights Reserved.